


“I didn’t see them until it was too late!” This phrase often appears in the statements of drivers involved in a nighttime collision, especially when pedestrians are involved. In many cases, it will be very true. Pedestrians often place themselves in situations in which even the alert average driver would be unable to avoid them.
A Visual Primer
In a study of pedestrian accident reports by the Indiana Department of Motor Vehicles, 87% of drivers who struck a pedestrian at night claimed they could not see the pedestrian. In the daytime, this dropped to 11.8%. While this conclusion appears to confirm our common sense expectations, it also suggests that we have very different visual systems functioning in the day and night.
Light enters our eye through the cornea (Figure 1). The cornea, together with the lens, will focus an image on the retina, an area covering about two thirds of the eye’s interior which is covered with light sensitive cells. There is a small depression in the center of the retina called the fovea which represents our zone of highest visual acuity. However, the fovea represents only a small area within our visual field, about 2 degrees. For this reason, detection of a hazard would typically occur in the peripheral area of the retina. The eye would then focus its foveal area on the hazard for identification.
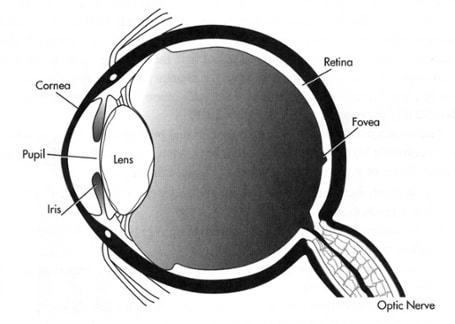 Figure 1: Eye Nomenclature1
There are two general types of light-sensitive receptor cells on the retina: rods and cones. The rods are located in the periphery, are insensitive to colour, and function at lower light levels. The cones are colour sensitive and function at higher light levels. They are the only cell present in the fovea but are also scattered throughout the periphery of the retina. There are about 120 million rod cells and 4.5 million cone cells in the eye.
In the daytime, our eyes operate in what is termed the photopic range and only the cone cells are functional. As light levels are decreased through twilight, the rods and cones function together in the mesopic range. Finally, at light levels consistent with viewing average earth under a full moon, only the rods are functional. This is called the scotopic range. In this range, the eye will be completely colour blind and the foveal region of the eye, which contains only cone cells, will be blind.
When operating a motor vehicle, the pavement in front of the driver will generally be illuminated by the vehicle’s headlights. Additionally, for some incidents, there may be illumination from streetlights. Thus, the driver will never be truly dark-adapted and will generally be operating in the mesopic range where both rod and cone cells are functional. However, the effectiveness of the cones will be reduced so colour vision and visual acuity (the ability to resolve fine detail) are reduced.
Detection Distance
Research has been performed to assess the range of detection distances at which a driver may detect a pedestrian under nighttime conditions. Given the range of factors which can affect driver visibility, these tests are really only applicable to incidents which replicate their conditions. However, they provide an excellent starting point to any visibility analysis.
Olson and Sivak performed a test in which pedestrians wearing either a white shirt or a dark shirt stood on the side of an unlit rural road.2 Driver and passenger subjects travelling at 40 km/h were equipped with a control box containing a number of buttons corresponding to the various target types and locations so that the response distance of the subjects to the pedestrians could be recorded. Two subject groups were considered: young (18 to 30 years) and older (65 years or more). There were very different results depending on the age of the subject, the pedestrian’s clothing, and the side of the road the pedestrian was standing on. The average detection distances for the young and older subjects are shown in Figures 2 and 3.
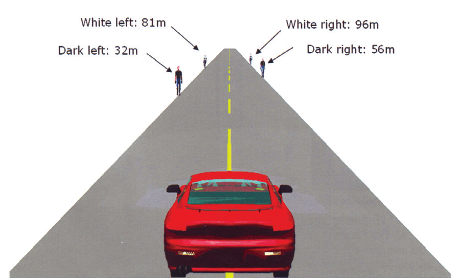
Figure 2: Average detection distances for young drivers (18 to 30 years)
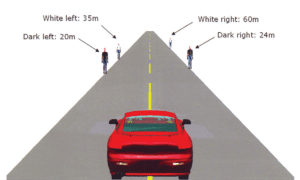
Figure 3: Average detection distances for older drivers (over 65 years)
It may be somewhat intuitive that a younger driver could see a pedestrian from further away than an older driver or that a pedestrian wearing white could be seen from further away than one dressed in black. However, the finding that a pedestrian on the right could be seen from further away than one on the left may not be as obvious. This is affected by the aim of low beam headlights.
Low beam vehicle headlighting represents a compromise between providing as much forward light as possible for the driver while minimizing the light that would be shining into the eyes of oncoming drivers. As a result, the low beam pattern is biased to the right (Figure 4). Hence, more light will reach objects on the right side of the road and they will generally be seen from further away.
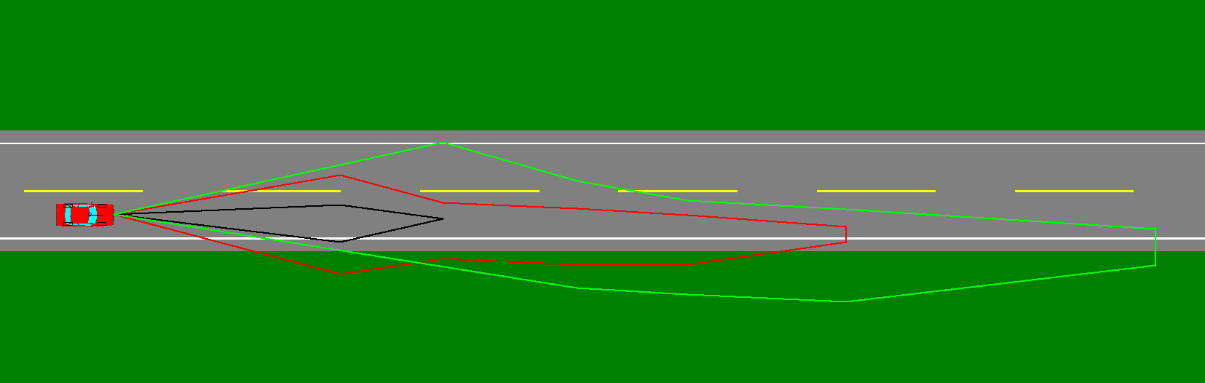 Figure 4: Typical low beam headlight pattern at ground (green), headlight height (red), and eye height (black).
Expectancy
The accident reconstructionist must be careful in applying experimental detection data to a real-world incident. In most experiments, the subjects have been told to expect pedestrians on the side of the road and have been shown what they look like prior to collecting the data. This is a very different state of awareness than the typical driver on the road would have. Thus, we must correct in some way for expectancy.
Roper and Howard performed an experiment in which drivers were unexpectedly confronted with a pedestrian dummy in front of their vehicle and their response distance was recorded.3 The experiment was redone with the driver now aware that the dummy was in their path. Under these expectant conditions, the drivers were able to detect the dummy from about twice as far away.
If a correction factor for expectancy is applied to the data presented earlier for older drivers, the results are shown in Figure 5. The speeds a vehicle would need to be travelling to allow avoidance by a 50th percentile driver are also shown in the figure. Of course, as with any human performance characteristic, there would be significant range in the population as well. These values suggest that on an unlit road, drivers will usually be overdriving their headlights even if they are travelling at the speed limit.
Scene Recreation and Visibility Modelling
When a scene is substantially different from the available detection data in the literature, it becomes necessary for the investigator to recreate the scene as closely as possible in order to assess driver visibility. Depending on the traffic volume, this may require closure of the road. If possible, a similar vehicle should be used. Also, similar pedestrian clothing should be used. Glare sources, such as oncoming headlights should also be accounted for and care should be taken to assure that the ambient light will be similar to that on the date of incident.
While photographs may be taken at the scene as a demonstrative aid, they should not be relied upon as an indicator of visibility. There are numerous reasons for this:
- The camera output can be varied with exposure time and aperture settings.
- The dynamic range of the film (that is, the range from the lightest to the darkest areas it can record) is not as wide as that of the eye.
- The camera’s field of view will not match that of a driver.
- When looking at a photograph, the viewer’s eyes are typically adapted to a completely different state than the nighttime driver.
- The viewer can stare at a photograph for an unlimited time whereas the driver is facing a dynamically changing scene.
- The sizes of objects in the photograph are different than actual.
- The viewer is aware that there is a target in the photograph whereas the driver was not.
The investigator should also not rely solely upon their personal observations of the scene. Since age and individual differences affect visibility so greatly, using the sight distance of one investigator could be akin to assuming the average height of the population based on the observation of one basketball player. In addition, the investigator is aware of the hazard’s presence and this awareness will lead to improved performance. It is much more prudent to compare the driver, whose nighttime visual abilities are typically unknown, with a population average. The most important detection criteria in nighttime conditions is luminance contrast; that is, how much light does the hazard reflect or emit in comparison to the light reflected or emitted by their background. The hazard may in positive contrast (brighter than its background) or negative contrast (darker than its background). Vehicle headlights typically create positive contrast as they will illuminate a pedestrian to a greater extent than the background which is far beyond them. Streetlights on the other hand tend to create negative contrast as they will light the road surface to a greater extent than the vertical pedestrian. The combination of streetlights and headlights could then potentially reduce the overall contrast between the pedestrian and their background.
Using a luminance meter, the luminance of the surrogate pedestrian and their background can be recorded at various positions from the approaching driver’s view. This method removes all subjectivity from the analysis as the actual contrast can be calculated. Whether or not this contrast is sufficient for detection by the average driver in the specific scenario requires further analysis.
One of the design approaches recommended by the Illuminating Engineering Society of North America for roadway lighting layout is small target visibility (STV).4,5 This is based on a visibility metric which incorporates factors for target and background luminance, target size, observer age and observation time, contrast polarity (positive or negative), and glare to calculate a Visibility Level. A Visibility Level of one is defined as that value needed for 99.9% of laboratory observers to detect a target. Since a driver on the road is occupied with many additional tasks, it is expected that they would require some multiple of this threshold value for detection.
Research has been performed to calibrate this visibility model for nighttime driving conditions.6 That is, the Visibility Levels that are required by the average alerted or unalerted driver under various scenarios have been determined. Using the contrast measurements gathered at the scene, Visibility Levels can be calculated to determine the likely position where an average driver could detect the hazard. From that point, a typical avoidance analysis can be performed allowing a suitable perception/response time. In many cases, this approach will show that the average driver simply did not have sufficient time and distance available to avoid.
The Pedestrian’s Point of View
For a driver, the pedestrian at night often represents a dark target viewed against a dark background – an inherently difficult hazard to detect. Conversely, if the vehicle headlights are on, they will function as a very high contrast target against the dark background. So, why do pedestrians cross in front of approaching motor vehicles?
There are several possibilities. First, people generally have difficulty judging the approach speed of vehicles. If the only visible cue is a pair of headlights, this judgment could be even more difficult. Secondly, weather conditions may lead pedestrians to exhibit risky crossing behaviours. For example, the “duck the head and run” motion which is common in the rain or the use of umbrellas (most often, black) without taking the time to glance around them toward traffic are obviously problematic. Finally, studies have shown that pedestrians will generally overestimate the distance that they believe they can be seen from.
Allen et al had pedestrians on the side of the road estimate the positions from which they believed an approaching driver could see them.7 At the same time, the approaching drivers indicated the distances from which they could see the pedestrians. On average, the pedestrians thought they could be seen from twice as far away. If we apply the expectancy correction to this data, it is likely that pedestrians estimate they can be seen from four times further than the driver is actually capable of. This is why it is recommended that pedestrians not cross until they have made eye contact with the driver.
Summary
There are physical reasons for a driver’s reduced visual performance at night. The increased dominance of the rod cells means that luminance, or brightness, contrast becomes the primary detection cue available
to a driver. That is, how bright, does a pedestrian appear to be relative to its background? Since vehicle and roadway lighting create this contrast in different ways, they may actually reduce the available contrast in certain combinations. If contrast is reduced, the driver’s detection distance will also be reduced.
Other factors leading to lower detection distances are poor weather, driver age, the presence of oncoming glare, a smaller target size, and target position. Due to the aim of low beam headlights, pedestrians on the left will be less visible than those on the right. These factors can be accounted for in scene recreations where the reflected light from a surrogate pedestrian and their background can be measured. Calculations
can then be performed to determine the position where an average driver could have detected the pedestrian. This may be particularly useful in avoidance analyses to aid in liability apportionment.
References
1. Olson PL (1996). Forensic Aspects of Driver Perception and Response. Lawyers & Judges Publishing Co.: Tucson, AZ
2. Olson PL and Sivak M (1983). “Improved Low-Beam Photometrics”, UMTRI-83-9. National Highway Traffic Safety Administration: Washington, D.C.
3. Roper VJ and Howard EA (1937). “Seeing with M otor Car Headlamps”. Thirty-First Annual Convention of the Illuminating Engineering Society: White Sulphur Springs, WV.
4. IESNA (2000). “American National Standard Practice for Roadway Lighting”, ANSI/IESNA RP-8-00.
Illuminating Engineering Society of North America: New York, NY.
5. Adrian W (1989). “Visibility of Targets: Model for Calculation.” Lighting Research and Technology.
6. Ising KW, Fricker TRC, Lawrence JM and Siegmund GP (2003). “Threshold Visibility Levels for the Adrian Visibility Model under Nighttime Driving Conditions”, SAE 2003-01-0294. Society of Automotive Engineers: Warrendale, PA.
7. Allen MJ, Hazlett RD, Tacker HL and Graham BV (1970). “Actual Pedestrian Visibility and the Pedestrian’s Estimate of his own Visibility.” American Journal of Optometry.
As published in Without Predjudice, June 2008.